The table shows the distribution of marks obtained by some candidates in a test.
Draw a histogram for the distribution.
| Marks | 10-14 | 15-24 | 25-29 | 30-39 | 40-44 | 45-49 |
| No of candidates | 14 | 30 | 22 | 18 | 12 | 4 |
Draw a histogram for the distribution.
Take Free Practice Test On 2026 JAMB UTME, Post UTME, WAEC SSCE, GCE, NECO SSCE
Correct Answer: Option n
Explanation:
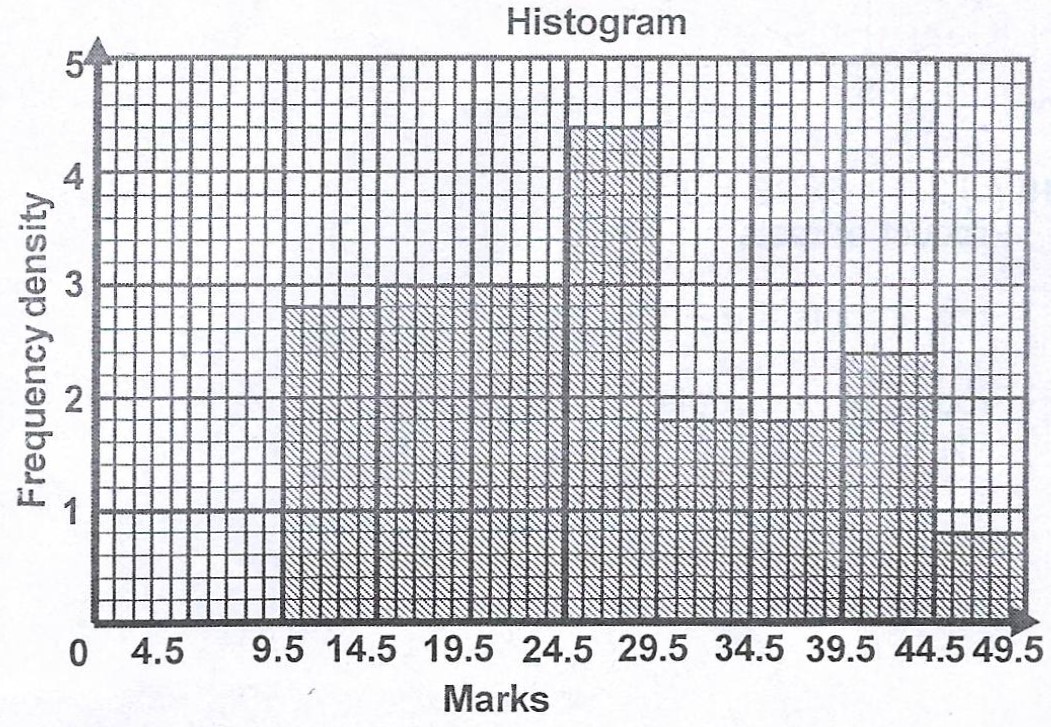
Since the class intervals are not equal, we draw the histogram in a way that the area of the bars, rather than the height must be proportional to the frequency. On the vertical scale, we plot frequency density instead of frequency where frequency density = frequency/ class width.
| Marks | Freq | Class boundary | Class width | Height |
| 10 - 14 | 14 | 9.5 - 14.5 | 5 | 2.8 |
| 15 - 24 | 30 | 14.5 - 24.5 | 10 | 3 |
| 25 - 29 | 22 | 24.5 - 29.5 | 5 | 4.4 |
| 30 - 39 | 18 | 29.5 - 39.5 | 10 | 1.8 |
| 40 - 44 | 12 | 39.5 - 44.5 | 5 | 2.4 |
| 45 - 49 | 4 | 44.5 - 49.5 | 5 | 0.8 |
Since the class intervals are not equal, we draw the histogram in a way that the area of the bars, rather than the height must be proportional to the frequency. On the vertical scale, we plot frequency density instead of frequency where frequency density = frequency/ class width.