(a) The distribution of the lives (in days) of 40 transitor batteries is shown in the table:
(a) Draw a histogram for the distribution.
(b) Use your graph in (a) to determine the mode for the distribution.
(c) Using an assumed mean of 43 days, calculate the mean of the distribution.
(d) What percentage number of batteries will live for less than 31 days or more than 45 days?
| Battery life(in days) | 26-30 | 31-35 | 36-40 | 41-45 | 46-50 | 51-55 |
| Frequency | 4 | 7 | 13 | 8 | 6 | 2 |
(a) Draw a histogram for the distribution.
(b) Use your graph in (a) to determine the mode for the distribution.
(c) Using an assumed mean of 43 days, calculate the mean of the distribution.
(d) What percentage number of batteries will live for less than 31 days or more than 45 days?
Take Free Practice Test On 2026 JAMB UTME, Post UTME, WAEC SSCE, GCE, NECO SSCE
Correct Answer: Option n
Explanation:
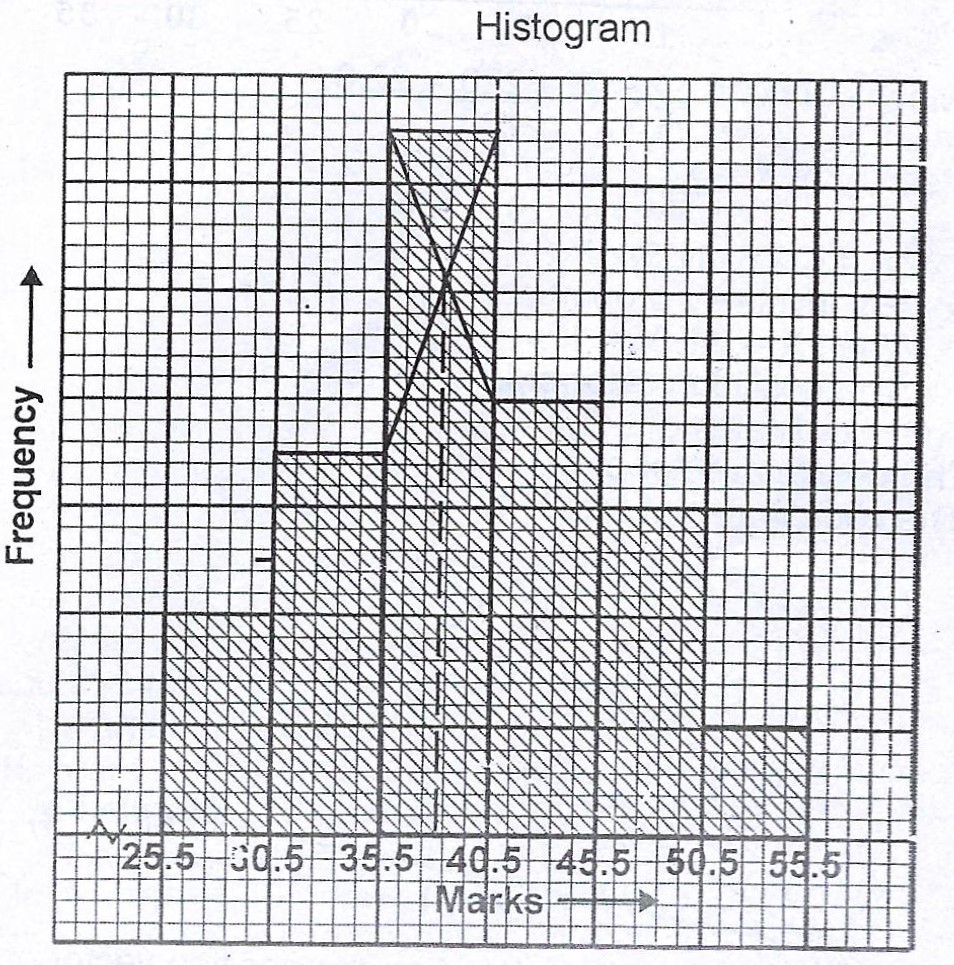
(b) Mode = 38.4
(c) Assumed mean, A = 43 days
Mean \(\bar{x} = A + \frac{\sum fd}{\sum f}\)
= \(43 + \frac{-145}{40}\)
= \(43 - 3.625\)
= \(39.375\)
(d) Number of batteries that will live for less than 31 days or more than 45 days = 4 + 6 + 2 = 12
\(%age = \frac{12}{40} \times 100% = 30%\)
| Battery life (in days) | Freq | Class boundaries |
| 26 - 30 | 4 | 25.5 - 30.5 |
| 31 - 35 | 7 | 30.5 - 35.5 |
| 36 - 40 | 13 | 35.5 - 40.5 |
| 41 - 45 | 8 | 40.5 - 45.5 |
| 46 - 50 | 6 | 45.5 - 50.5 |
| 51 - 55 | 2 | 50.5 - 55.5 |
| 40 |
(b) Mode = 38.4
(c) Assumed mean, A = 43 days
| Battery life(in days) | Mid-mark(x) | Frequency(f) | \(d = x - A\) | \(fd\) |
| 26 - 30 | 28 | 4 | -15 | -60 |
| 31 - 35 | 33 | 7 | -10 | -70 |
| 36 - 40 | 38 | 13 | -5 | -65 |
| 41 - 45 | 43 | 8 | 0 | 0 |
| 46 - 50 | 48 | 6 | 5 | 30 |
| 51 - 55 | 53 | 2 | 10 | 20 |
| 40 | -145 |
Mean \(\bar{x} = A + \frac{\sum fd}{\sum f}\)
= \(43 + \frac{-145}{40}\)
= \(43 - 3.625\)
= \(39.375\)
(d) Number of batteries that will live for less than 31 days or more than 45 days = 4 + 6 + 2 = 12
\(%age = \frac{12}{40} \times 100% = 30%\)