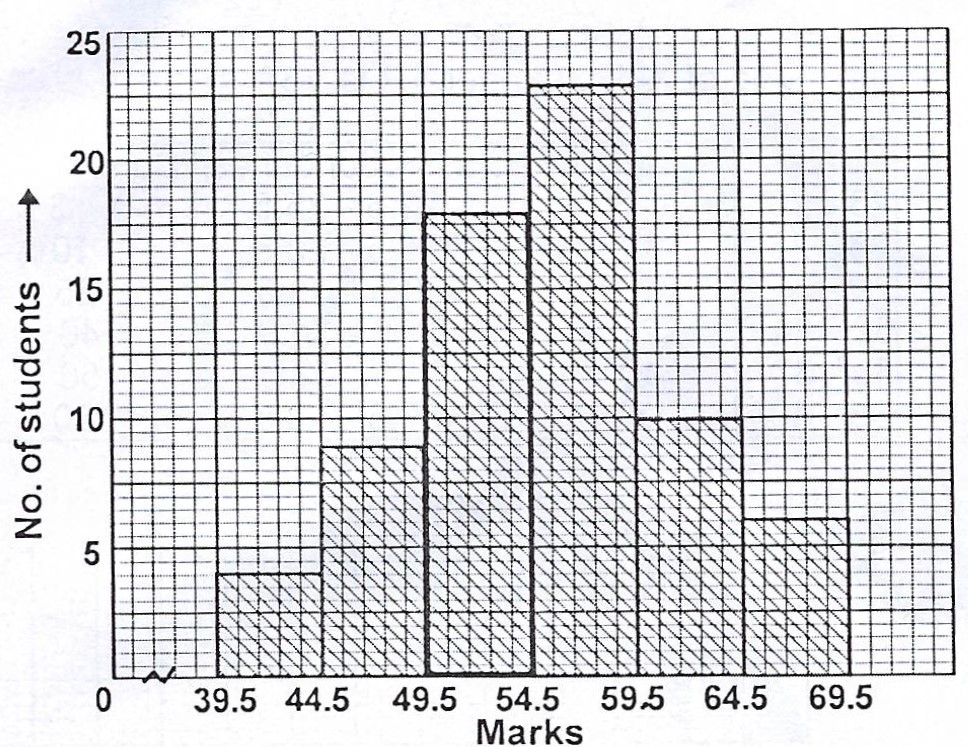
The table shows the marks obtained by a group of students in a class test.
(a) Draw a histogram for the distribution ;
(b) Use your histogram to estimate the median of the distribution.
| Marks | 40 - 44 | 45 - 49 | 50 - 54 | 55 - 59 | 60 - 64 | 65 - 69 |
| No ofstudents | 4 | 9 | 18 | 23 | 10 | 6 |
(a) Draw a histogram for the distribution ;
(b) Use your histogram to estimate the median of the distribution.
Take Free Practice Test On 2026 JAMB UTME, Post UTME, WAEC SSCE, GCE, NECO SSCE
Correct Answer: Option n
Explanation:
(b) Median = \(L_{1} + \frac{(\frac{N}{2} - \sum f_{1}) \times c}{f_{med}}\)
= \(54.5 + \frac{(\frac{70}{2} - 31) \times 5}{23}\)
= \(54.5 + 0.9 = 55.4\)
| Marks | No of students | Class boundaries |
| 40 - 44 | 4 | 39.5 - 44.5 |
| 45 - 49 | 9 | 44.5 - 49.5 |
| 50 - 54 | 18 | 49.5 - 54.5 |
| 55 - 59 | 23 | 54.5 - 59.5 |
| 60 - 64 | 10 | 59.5 - 64.5 |
| 65 - 69 | 6 | 64.5 - 69.5 |
| 70 |
(b) Median = \(L_{1} + \frac{(\frac{N}{2} - \sum f_{1}) \times c}{f_{med}}\)
= \(54.5 + \frac{(\frac{70}{2} - 31) \times 5}{23}\)
= \(54.5 + 0.9 = 55.4\)