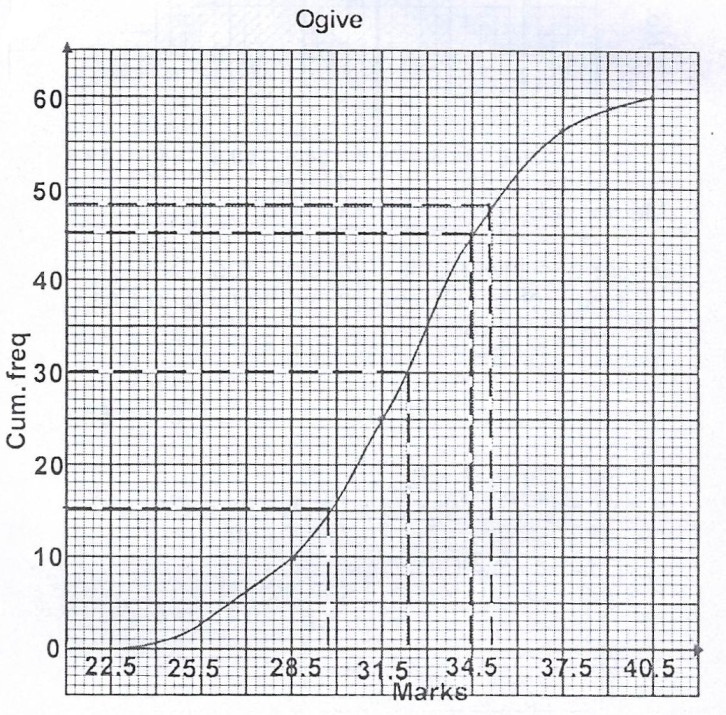
The table gives the distribution of marks of 60 candidates in a test.
(a) Draw a cumulative frequency curve of the distribution.
(b) From your curve, estimate the : (i) 80th percentile ; (ii) median ; (iii) semi-interquartile range.
| Marks | 23-25 | 26-28 | 29-31 | 32-34 | 35-37 | 38-40 |
| Frequency | 3 | 7 | 15 | 21 | 10 | 4 |
(a) Draw a cumulative frequency curve of the distribution.
(b) From your curve, estimate the : (i) 80th percentile ; (ii) median ; (iii) semi-interquartile range.
Take Free Practice Test On 2026 JAMB UTME, Post UTME, WAEC SSCE, GCE, NECO SSCE
Correct Answer: Option
Explanation:
(a)
(b)(i) 80th percentile = \(\frac{80 \times 60th}{100} = \text{48th mark}\).
= 31.5.
(ii) Median = \(\frac{60th}{2} = \text{30th mark} = 32.3\)
(iii) Upper quartile = \(\frac{3 \times 60th}{4} = \text{45th mark} = 35.1\)
Lower quartile = \(\frac{60th}{4} = \text{15th mark} = 29.7\)
Semi-interquartile range = \(\frac{35.1 - 29.7}{2} = 2.7\)
| Marks | Freq | Class Boundaries | Cum. Freq |
| 23 - 25 | 3 | 22.5 - 25.5 | 3 |
| 26 - 28 | 7 | 25.5 - 28.5 | 10 |
| 29 - 31 | 15 | 28.5 - 31.5 | 25 |
| 32 - 34 | 21 | 31.5 - 34.5 | 46 |
| 35 - 37 | 10 | 34.5 - 37.5 | 56 |
| 38 - 40 | 4 | 37.5 - 40.5 | 60 |
(a)
(b)(i) 80th percentile = \(\frac{80 \times 60th}{100} = \text{48th mark}\).
= 31.5.
(ii) Median = \(\frac{60th}{2} = \text{30th mark} = 32.3\)
(iii) Upper quartile = \(\frac{3 \times 60th}{4} = \text{45th mark} = 35.1\)
Lower quartile = \(\frac{60th}{4} = \text{15th mark} = 29.7\)
Semi-interquartile range = \(\frac{35.1 - 29.7}{2} = 2.7\)