The table shows the frequency distribution of marks scored by some candidates in an examination.
(a) Draw the cumulative frequency curve of the distribution.
(b) Use your graph to estimate the :
(i) semi-interquartile range of the distribution; (ii) percentage of candidates who passed with distinction if the least mark for distinction was 72.
| Marks | 0-9 | 10-19 | 20-29 | 30-39 | 40-49 | 50-59 | 60-69 | 70-79 | 80-89 | 90-99 |
| Freq | 2 | 5 | 8 | 18 | 20 | 15 | 5 | 4 | 2 | 1 |
(a) Draw the cumulative frequency curve of the distribution.
(b) Use your graph to estimate the :
(i) semi-interquartile range of the distribution; (ii) percentage of candidates who passed with distinction if the least mark for distinction was 72.
Take Free Practice Test On 2026 JAMB UTME, Post UTME, WAEC SSCE, GCE, NECO SSCE
Correct Answer: Option n
Explanation:
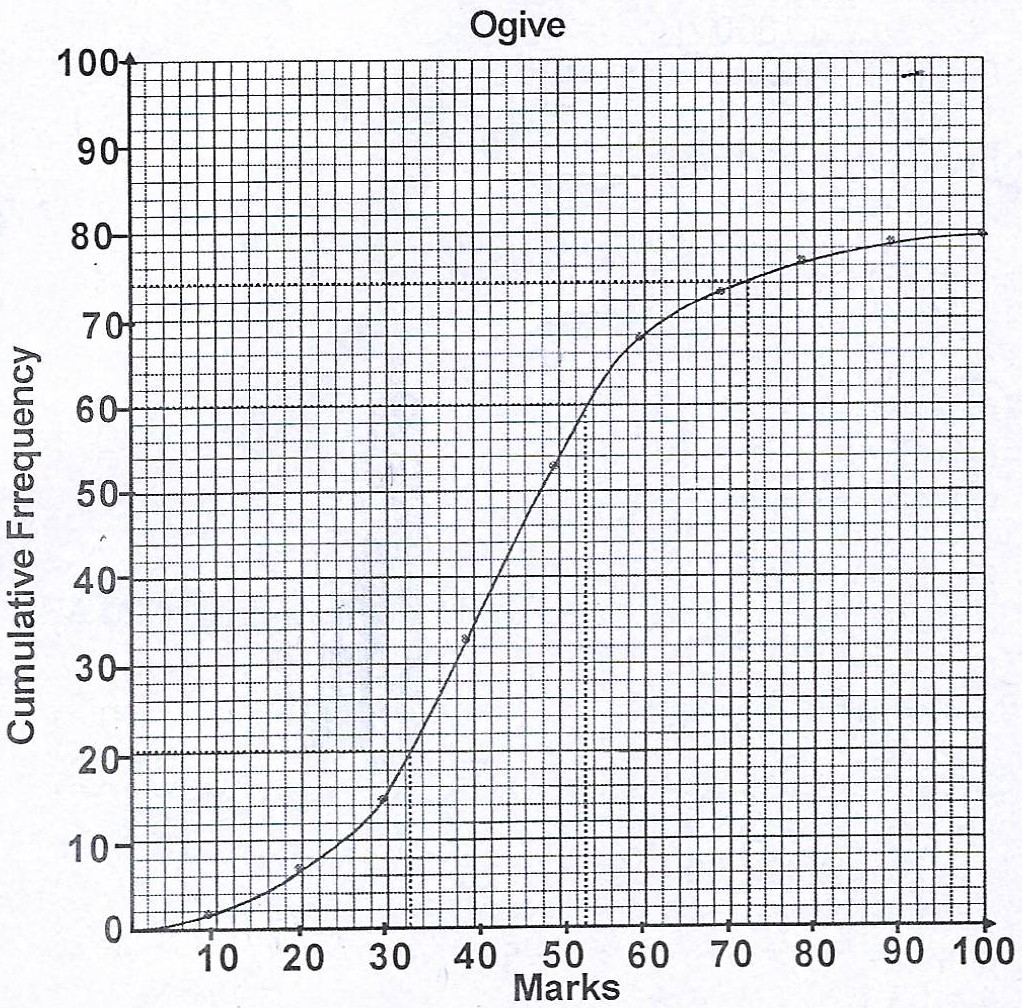
(a)
(b)(i) Lower quartile, \(Q_{1} = 32.5\)
Upper quartile, \(Q_{3} = 53.0\)
Semi-interquartile range = \(\frac{1}{2} (Q_{3} - Q_{1})\)
= \(\frac{1}{2} (53.0 - 32.5) = \frac{1}{2} (20.5)\)
= \(10.25\)
(ii) Number of students that passed with distinction = (80 - 74)
= 6 students
Percentage = \(\frac{6}{80} \times 100% = 7.5%\)
| Marks | Class boundaries | Freq | Cum Freq |
| 0-9 | 0 - 9.5 | 2 | 2 |
| 10 - 19 | 9.5 - 19.5 | 5 | 7 |
| 20 - 29 | 19.5 - 29.5 | 8 | 15 |
| 30 - 39 | 29.5 - 39.5 | 18 | 33 |
| 40 - 49 | 39.5 - 49.5 | 20 | 53 |
| 50 - 59 | 49.5 - 59.5 | 15 | 68 |
| 60 - 69 | 59.5 - 69.5 | 5 | 73 |
| 70 - 79 | 69.5 - 79.5 | 4 | 77 |
| 80 - 89 | 79.5 - 89.5 | 2 | 79 |
| 90 - 99 | 89.5 - 99.5 | 1 | 80 |
(a)
(b)(i) Lower quartile, \(Q_{1} = 32.5\)
Upper quartile, \(Q_{3} = 53.0\)
Semi-interquartile range = \(\frac{1}{2} (Q_{3} - Q_{1})\)
= \(\frac{1}{2} (53.0 - 32.5) = \frac{1}{2} (20.5)\)
= \(10.25\)
(ii) Number of students that passed with distinction = (80 - 74)
= 6 students
Percentage = \(\frac{6}{80} \times 100% = 7.5%\)