The marks scored by 35 students in a test are given in the table below.
Draw a histogram for the distribution.
| Marks | 1-5 | 6-10 | 11-15 | 16-20 | 21-25 | 26-30 |
| Frequency | 2 | 7 | 12 | 8 | 5 | 1 |
Draw a histogram for the distribution.
Take Free Practice Test On 2026 JAMB UTME, Post UTME, WAEC SSCE, GCE, NECO SSCE
Correct Answer: Option
Explanation:
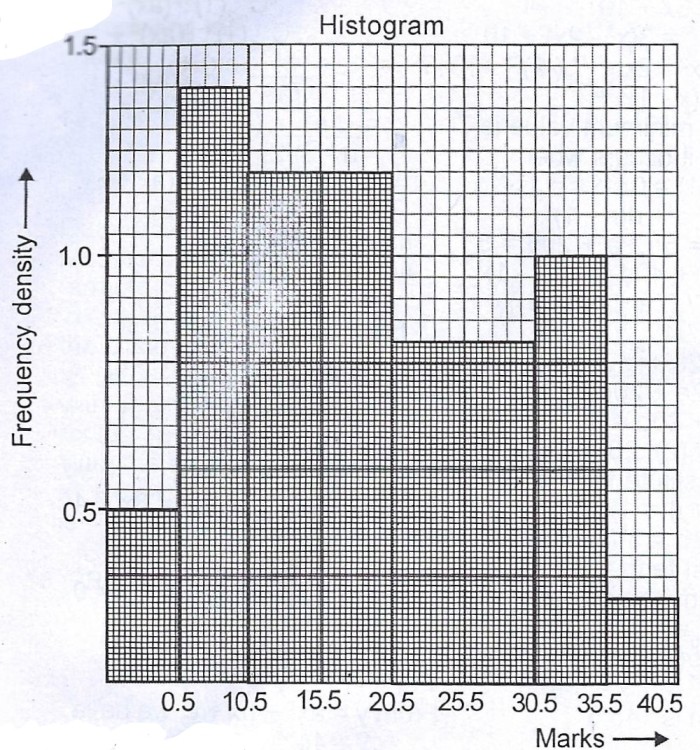
| Marks | Class boundaries | Frequency |
| 1 - 5 | 0.5 - 5.5 | 2 |
| 6 - 10 | 5.5 - 10.5 | 7 |
| 11 - 20 | 10.5 - 20.5 | 12 |
| 21 - 30 | 20.5 - 30.5 | 8 |
| 31 - 35 | 30.5 - 35.5 | 5 |
| 36 - 40 | 35.5 - 40.5 | 1 |
| 35 |