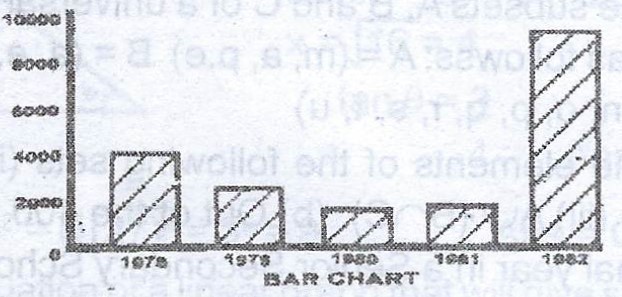
The number of items produced by a company over a five- year period is given below:
(i) Plot a bar chart for this information; (ii) What is the average production for the five- year period.
| Year | 1978 | 1979 | 1980 | 1981 | 1982 |
| No produced | 4100 | 2500 | 1500 | 1800 | 9200 |
(i) Plot a bar chart for this information; (ii) What is the average production for the five- year period.
Take Free Practice Test On 2026 JAMB UTME, Post UTME, WAEC SSCE, GCE, NECO SSCE
Correct Answer: Option n
Explanation:
(i)
(ii) Average production in the period
= \(\frac{4100 + 2500 + 1500 + 1800 + 9200}{5}\)
= \(\frac{19100}{5}\)
= \(3820\)
(i)
(ii) Average production in the period
= \(\frac{4100 + 2500 + 1500 + 1800 + 9200}{5}\)
= \(\frac{19100}{5}\)
= \(3820\)