The table shows the weights, to the nearest kilogram, of twelve students in a Further Mathematics class
(a) Draw a bar chart to illustrate the above information;
(b) What is (i) the mode; (ii) the median of the distribution?
(c) Calculate the mean weight correct to the nearest kilogram.
| Weight in kg | 55 | 57 | 59 | 61 | 63 |
| No of students | 2 | 1 | 2 | 4 | 3 |
(a) Draw a bar chart to illustrate the above information;
(b) What is (i) the mode; (ii) the median of the distribution?
(c) Calculate the mean weight correct to the nearest kilogram.
Take Free Practice Test On 2026 JAMB UTME, Post UTME, WAEC SSCE, GCE, NECO SSCE
Correct Answer: Option n
Explanation:
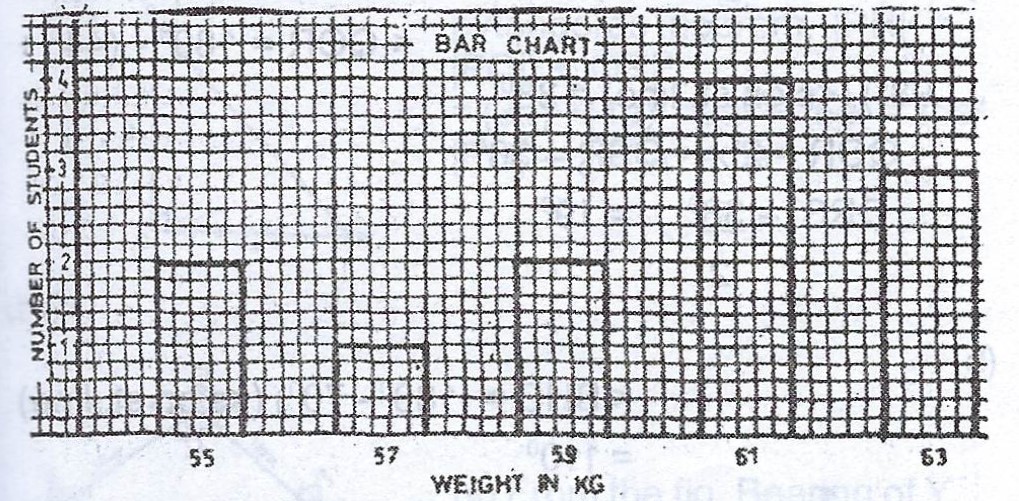
(a)
(b)(i) The mode is 61kg.
(ii) From the total number of students = 12, then the median is the average of the 6th and 7th weight.
From the table, the median = 61kg.
(c) Mean weight = \(\frac{\sum fx}{\sum f} = \frac{55 \times 2 + 57 \times 1 + 59 \times 2 + 61 \times 4 + 63 \times 3}{12}\)
= \(\frac{110 + 57 + 118 + 244 + 189}{12} = \frac{718}{12} = 59.833kg\)
\(\approxeq 60kg\)