(a) The distribution of junior workers in an institution is as follows: Clerks - 78, Drivers - 36, Typists - 44, Messengers - 52, Others - 30. Represent the above information by a pie chart.
(b) The table below shows the frequency distribution of marks scored by 30 candidates in an aptitude test.
Find the mean score to the nearest whole number.
(b) The table below shows the frequency distribution of marks scored by 30 candidates in an aptitude test.
| Marks | 4 | 5 | 6 | 7 | 8 | 9 |
| No of candidates | 5 | 8 | 5 | 6 | 4 | 2 |
Find the mean score to the nearest whole number.
Take Free Practice Test On 2026 JAMB UTME, Post UTME, WAEC SSCE, GCE, NECO SSCE
Correct Answer: Option n
Explanation:
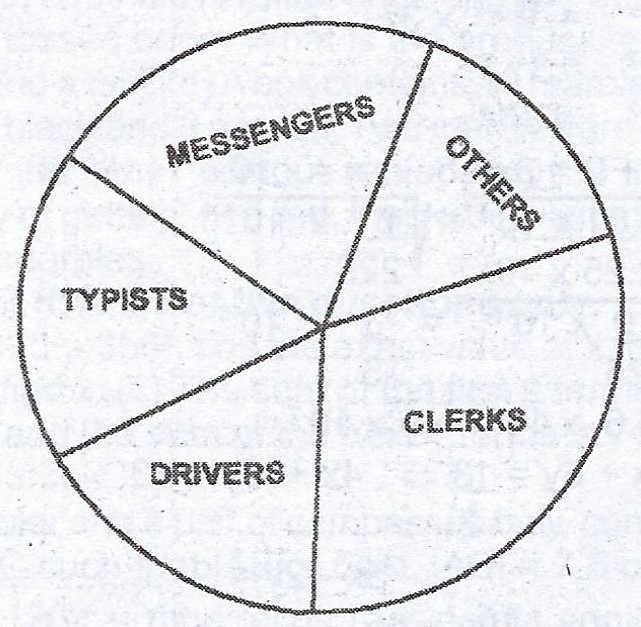
(a) Sector angle represented by the officers:
Total number of officers = 240
Clerks = \(\frac{78}{240} \times 360° = 117°\)
Drivers = \(\frac{36}{240} \times 360° = 54°\)
Typists = \(\frac{44}{240} \times 360° = 66°\)
Messengers = \(\frac{52}{240} \times 360° = 78°\)
Others = \(\frac{30}{240} \times 360° = 45°\)
(b)
Mean score = \(\frac{\sum fx}{\sum f}\)
= \(\frac{182}{30}\)
= \(6.067\) marks \(\approxeq\) 6 marks to the nearest whole number.
(a) Sector angle represented by the officers:
Total number of officers = 240
Clerks = \(\frac{78}{240} \times 360° = 117°\)
Drivers = \(\frac{36}{240} \times 360° = 54°\)
Typists = \(\frac{44}{240} \times 360° = 66°\)
Messengers = \(\frac{52}{240} \times 360° = 78°\)
Others = \(\frac{30}{240} \times 360° = 45°\)
(b)
| Marks (x) | 4 | 5 | 6 | 7 | 8 | 9 | Total |
| No of candidates (f) | 5 | 8 | 5 | 6 | 4 | 2 | 30 |
| \(fx\) | 20 | 40 | 30 | 42 | 32 | 18 | 182 |
Mean score = \(\frac{\sum fx}{\sum f}\)
= \(\frac{182}{30}\)
= \(6.067\) marks \(\approxeq\) 6 marks to the nearest whole number.