The table below shows how a company's sales manager spent his 1995 annual salary.
(a) Represent this information on a pie chart.
(b) Find his savings at the end of the year if his annual salary was N60,000.00.
| Food | 30% |
| Rent | 18% |
| Car Maintenance | 25% |
| Savings | 12% |
| Taxes | 5% |
| Others | 10% |
(a) Represent this information on a pie chart.
(b) Find his savings at the end of the year if his annual salary was N60,000.00.
Take Free Practice Test On 2026 JAMB UTME, Post UTME, WAEC SSCE, GCE, NECO SSCE
Correct Answer: Option n
Explanation:
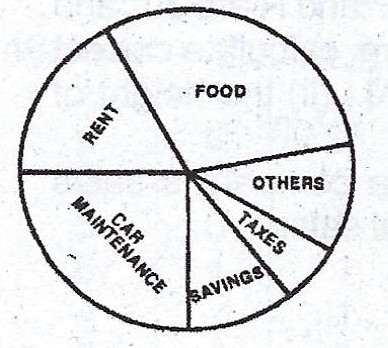
Angle of sector:
\(Food = \frac{30}{100} \times 360° = 108°\)
\(Rent = \frac{18}{100} \times 360° = 64.8°\)
\(\text{Car Maintenance} = \frac{25}{100} \times 360° = 90°\)
\(Savings = \frac{12}{100} \times 360° = 43.2°\)
\(Taxes = \frac{5}{100} \times 360° = 18°\)
\(Others = \frac{10}{100} \times 360° = 36°\)
(a)
(b) Annual Salary = N60,000.00
\(\therefore Savings = N(\frac{12}{100} \times 60,000) = N7,200\)