The following table shows the distribution of test scores in a class.
(a) If the mean score of the class is 6, find the : (i) value of k (ii) median score.
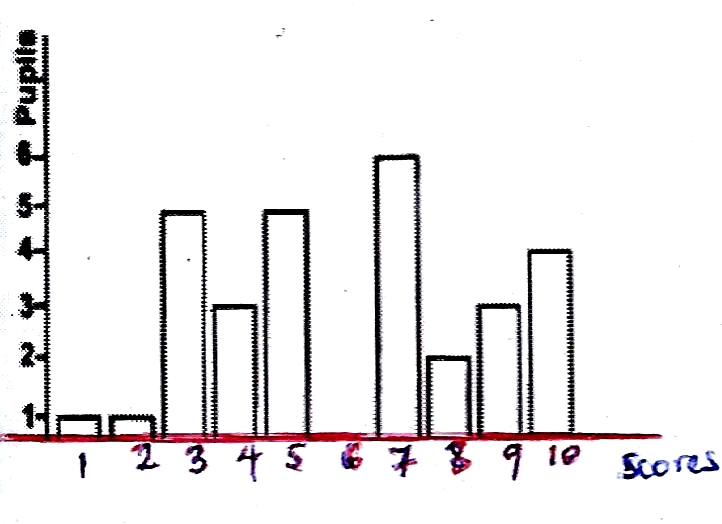
(b) Draw a bar chart for the distribution.
(c) If a pupil is picked at random, what is the probability that he/ she will score less than 6?
| Scores | 1 | 2 | 3 | 4 | 5 | 7 | 8 | 9 | 10 |
| No of pupils | 1 | 1 | 5 | 3 | \(k^{2} + 1\) | 6 | 2 | 3 | 4 |
(a) If the mean score of the class is 6, find the : (i) value of k (ii) median score.
(b) Draw a bar chart for the distribution.
(c) If a pupil is picked at random, what is the probability that he/ she will score less than 6?
Take Free Practice Test On 2026 JAMB UTME, Post UTME, WAEC SSCE, GCE, NECO SSCE
Correct Answer: Option
Explanation:
(a)
\(\bar{x} = \frac{\sum fx}{\sum f}\)
\(6 = \frac{5k^{2} + 160}{k^{2} + 26}\)
\(6(k^{2} + 26) = 5k^{2} + 160\)
\(6k^{2} + 156 = 5k^{2} + 160\)
\(6k^{2} - 5k^{2} = 160 - 156\)
\(k^{2} = 4\)
\( k = \sqrt{4} = 2\)
\(\therefore k = 2\)
(ii) \(Median = \frac{5 + 7}{2}\)
= \(\frac{12}{2} = 6\)
(b)
(c) Probability of scoring less than 6 = \(\frac{15}{30} \)
= \(\frac{1}{2}\)
(a)
| Scores (x) | 1 | 2 | 3 | 4 | 5 | 7 | 8 | 9 | 10 | Total |
| No of pupils (f) | 1 | 1 | 5 | 3 | \(k^{2} + 1\) | 6 | 2 | 3 | 4 | \(k^{2} + 26\) |
| fx | 1 | 2 | 15 | 12 | \(5k^{2} + 5\) | 42 | 16 | 27 | 40 | \(5k^{2} + 160\) |
\(\bar{x} = \frac{\sum fx}{\sum f}\)
\(6 = \frac{5k^{2} + 160}{k^{2} + 26}\)
\(6(k^{2} + 26) = 5k^{2} + 160\)
\(6k^{2} + 156 = 5k^{2} + 160\)
\(6k^{2} - 5k^{2} = 160 - 156\)
\(k^{2} = 4\)
\( k = \sqrt{4} = 2\)
\(\therefore k = 2\)
(ii) \(Median = \frac{5 + 7}{2}\)
= \(\frac{12}{2} = 6\)
(b)
(c) Probability of scoring less than 6 = \(\frac{15}{30} \)
= \(\frac{1}{2}\)