The pie chart shows the distribution of 4320 students who graduated from four departments in a university. If a student is picked at random from the four departments, what id the probability that he is not from the education department?
Take Free Practice Test On 2026 JAMB UTME, Post UTME, WAEC SSCE, GCE, NECO SSCE
Correct Answer: Option D
Explanation:
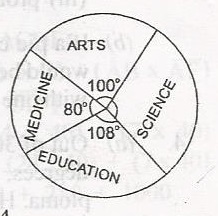
\(\frac{\text{education}}{\text{graduates}} = \frac{108}{360} \times 4320\)
= 1296
Pr(Education) = \(\frac{1296}{4320} = \frac{1}{10}\)
pr(not education) = 1 - \(\frac{3}{10}\)
= \(\frac{10 - 3}{10}\)
= \(\frac{7}{10}\)
\(\frac{\text{education}}{\text{graduates}} = \frac{108}{360} \times 4320\)
= 1296
Pr(Education) = \(\frac{1296}{4320} = \frac{1}{10}\)
pr(not education) = 1 - \(\frac{3}{10}\)
= \(\frac{10 - 3}{10}\)
= \(\frac{7}{10}\)