The frequency distribution table shows the marks obtained by 100 students in a Mathematics test.
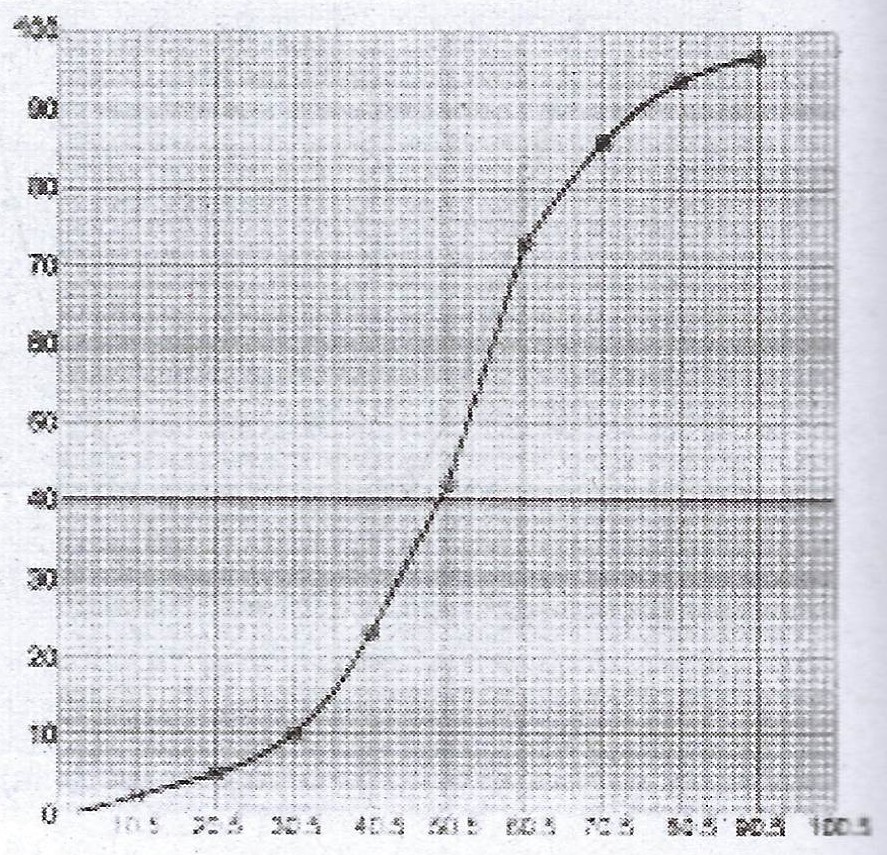
(a) Draw the cumulative curve for the distribution.
(b) Use the graph to find the : (i) 60th percentile ; (ii) probability that a student passed the test if the pass mark was fixed at 35%.
| Marks (%) | 1-10 | 11-20 | 21-30 | 31-40 | 41-50 | 51-60 | 61-70 | 71-80 | 81-90 | 91-100 |
| Frequency | 2 | 3 | 5 | 13 | 19 | 31 | 13 | 9 | 4 | 1 |
(a) Draw the cumulative curve for the distribution.
(b) Use the graph to find the : (i) 60th percentile ; (ii) probability that a student passed the test if the pass mark was fixed at 35%.
Take Free Practice Test On 2026 JAMB UTME, Post UTME, WAEC SSCE, GCE, NECO SSCE
Correct Answer: Option n
Explanation:
(a)
(b) (i) 60th percentile is where the line from the cumulative frequency of 60 touches the curve i.e. 60th percentile = 58.5
(ii) If the pass mark was fixed at 35%, then the frequency will be 13 with the class mark 31 - 40.
| Marks | frequency | cum freq | lower bound | upper bound |
| 1 - 10 | 2 | 2 | 0.5 | 10.5 |
| 11 - 20 | 3 | 5 | 10.5 | 20.5 |
| 21 - 30 | 5 | 10 | 20.5 | 30.5 |
| 31 - 40 | 13 | 23 | 30.5 | 40.5 |
| 41 - 50 | 19 | 42 | 40.5 | 50.5 |
| 51 - 60 | 31 | 73 | 50.5 | 60.5 |
| 61 - 70 | 13 | 86 | 60.5 | 70.5 |
| 71 - 80 | 9 | 95 | 70.5 | 80.5 |
| 81 - 90 | 4 | 99 | 80.5 | 90.5 |
| 91 - 100 | 1 | 100 | 90.5 | 100.5 |
(a)
(b) (i) 60th percentile is where the line from the cumulative frequency of 60 touches the curve i.e. 60th percentile = 58.5
(ii) If the pass mark was fixed at 35%, then the frequency will be 13 with the class mark 31 - 40.