The table below shows the marks obtained by forty pupils in a Mathematics test.
(a) Draw a histogram for the mark distribution ;
(b) Use your histogram to estimate the mode ;
(c) Calculate the median of the distribution.
| Marks | 0 - 9 | 10 - 19 | 20 - 29 | 30 - 39 | 40 - 49 | 50 - 59 |
| No of pupils | 4 | 5 | 6 | 12 | 8 | 5 |
(a) Draw a histogram for the mark distribution ;
(b) Use your histogram to estimate the mode ;
(c) Calculate the median of the distribution.
Take Free Practice Test On 2026 JAMB UTME, Post UTME, WAEC SSCE, GCE, NECO SSCE
Correct Answer: Option n
Explanation:
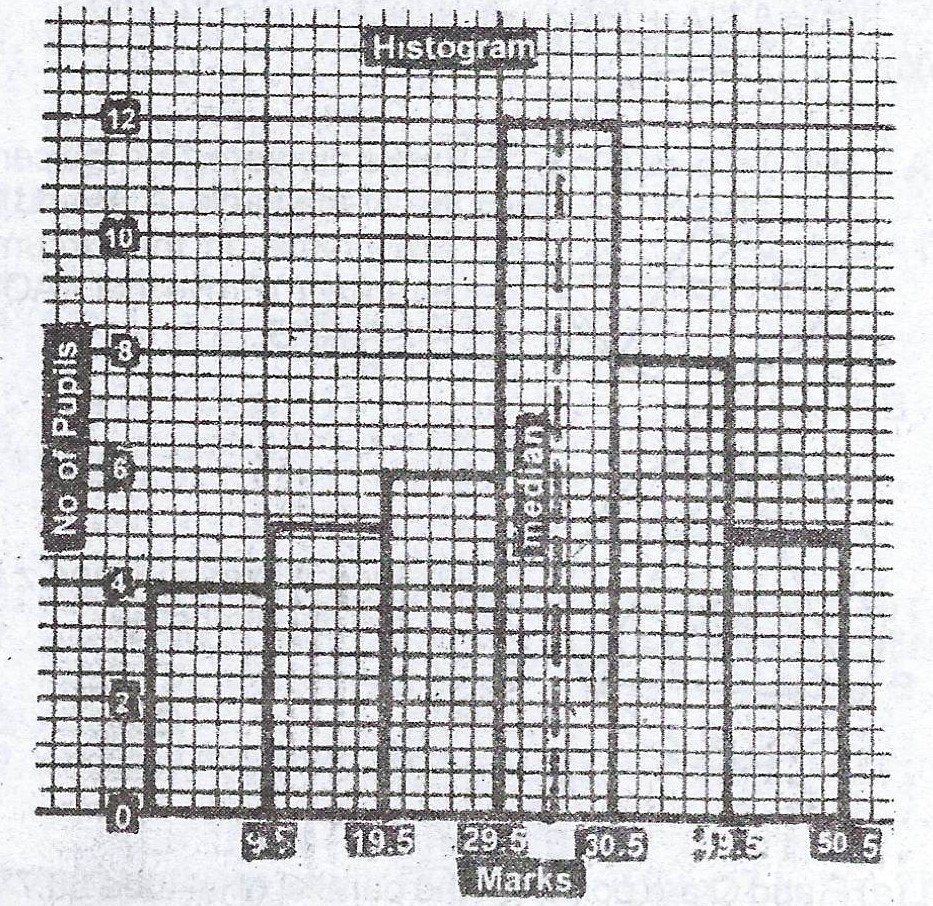
(a)
(b) Mode = 35.5
(c) Median = \(L_{1} + \frac{(\frac{N}{2} - \sum f_{p}) \times c}{f_{m}}\)
where \(L_{1}\) = lower class boundary of median class = 29.5
\(N = \sum f = 40\) ; \(\sum f_{p}\) = cumulative frequency before median class = 15.
\(f_{m}\) = frequency of median class = 12, c = class interval = 10.
Median = \(29.5 + \frac{(\frac{40}{2} - 15) \times 10}{12}\)
= \(29.5 + \frac{(20 - 15) \times 10}{12}\)
= \(29.5 + 4.17 = 33.67\)
(a)
| Marks | Class boundary | Freq | Cum freq |
| 0 - 9 | 0 - 9.5 | 4 | 4 |
| 10 - 19 | 9.5 - 19.5 | 5 | 9 |
| 20 - 29 | 19.5 - 29.5 | 6 | 15 |
| 30 - 39 | 29.5 - 39.5 | 12 | 27 |
| 40 - 49 | 39.5 - 49.5 | 8 | 35 |
| 50 - 59 | 49.5 - 59.5 | 5 | 40 |
(b) Mode = 35.5
(c) Median = \(L_{1} + \frac{(\frac{N}{2} - \sum f_{p}) \times c}{f_{m}}\)
where \(L_{1}\) = lower class boundary of median class = 29.5
\(N = \sum f = 40\) ; \(\sum f_{p}\) = cumulative frequency before median class = 15.
\(f_{m}\) = frequency of median class = 12, c = class interval = 10.
Median = \(29.5 + \frac{(\frac{40}{2} - 15) \times 10}{12}\)
= \(29.5 + \frac{(20 - 15) \times 10}{12}\)
= \(29.5 + 4.17 = 33.67\)