The diagram above shows the velocity-time graph of a vehicle. Its acceleration and retardation respectively are
Take Free Practice Test On 2026 JAMB UTME, Post UTME, WAEC SSCE, GCE, NECO SSCE
Correct Answer: Option C
Explanation:
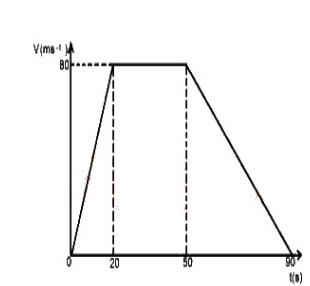
Acceleration = slope = AE/OE = 80/20 = 4m/s2
∴ acceleration and retardation = 4m/s2; 2m/s2
Acceleration = slope = AE/OE = 80/20 = 4m/s2
∴ acceleration and retardation = 4m/s2; 2m/s2