The diagram above represents the stress-strain graph for a typical metal rod. What does the X represent?
Take Free Practice Test On 2026 JAMB UTME, Post UTME, WAEC SSCE, GCE, NECO SSCE
Correct Answer: Option A
Explanation:
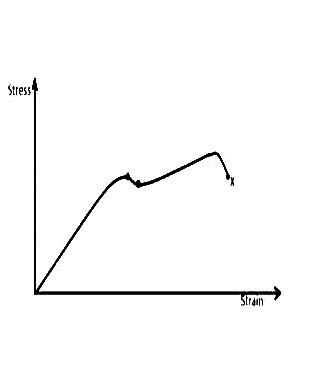
In the stress - strain graph shown above, X represents the breaking point of the wire
In the stress - strain graph shown above, X represents the breaking point of the wire