The diagram above shows a velocity - time graph. The statement that is true about this motion is that the car
Take Free Practice Test On 2026 JAMB UTME, Post UTME, WAEC SSCE, GCE, NECO SSCE
Correct Answer: Option A
Explanation:
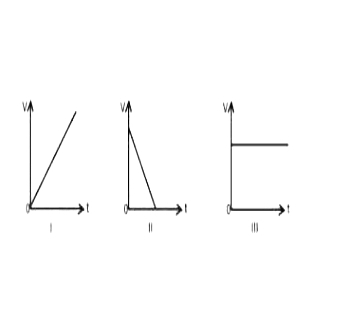
Above are the V-t graphs for
I Uniform acceleration
II uniform retardation
III Uniform velocity
Thus the car has no acceleration between point F and G since that portion of the graph represents uniform velocity
Above are the V-t graphs for
I Uniform acceleration
II uniform retardation
III Uniform velocity
Thus the car has no acceleration between point F and G since that portion of the graph represents uniform velocity