The table below shows the various possible combinations of military and civilian goods produced by a country, using the available resources and technology. Use the table to answer the questions that follow.
(a) Draw the production possibility curve (PPC).
(b) Indicate points S and K at which production is not feasible.
(c) Indicate points M and N at which resources are not efficiently utilized.
(d) What does the downward slope of the PPC indicate?
(e) Why is production not feasible at points S and K?
| Military goods (in toons) | Civilian goods (in toons) |
| 0 | 200 |
| 20 | 160 |
| 40 | 120 |
| 60 | 80 |
| 80 | 40 |
| 100 | 0 |
(a) Draw the production possibility curve (PPC).
(b) Indicate points S and K at which production is not feasible.
(c) Indicate points M and N at which resources are not efficiently utilized.
(d) What does the downward slope of the PPC indicate?
(e) Why is production not feasible at points S and K?
Take Free Practice Test On 2026 JAMB UTME, Post UTME, WAEC SSCE, GCE, NECO SSCE
Correct Answer: Option n
Explanation:
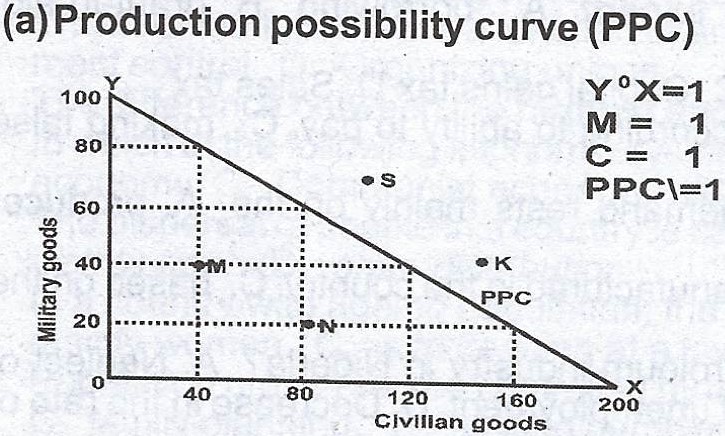
(b) Any 2 points outside the PPC labelled S and K
(c) Any 2 points inside the PPC labelled M and N
(d) The downward slope of the PPC indicates that there is an opportunity cost of producing more of one type of commodity and less of the other due to limited re-sources and technical know-how.
(e) Production at points S and K is not feasible due to the limited available resources and technology.Note: Military or civilian goods can be on either of the axis.