| Countries | Population (in million) | Gross National product (in million Dollars) |
| R | 120 | 2,500 |
| S | 180 | 12,000 |
| T | 60 | 4,000 |
| U | 100 | 6,500 |
| V | 25 | 2,500 |
(a)(i) Calculate the per capita incomes of countries R, S, T, U and V.
(ii) Determine the range of the per capita incomes of the five countries.
(iii) Which one of the countries enjoyed the highest standard of living?
(b) Express the population of each of countries R, S, T, U and V as a percentage of the total population of all the countries.
(c) Draw a simple bar chart showing all the countries and their respective per capita incomes.
Take Free Practice Test On 2026 JAMB UTME, Post UTME, WAEC SSCE, GCE, NECO SSCE
Correct Answer: Option n
Explanation:
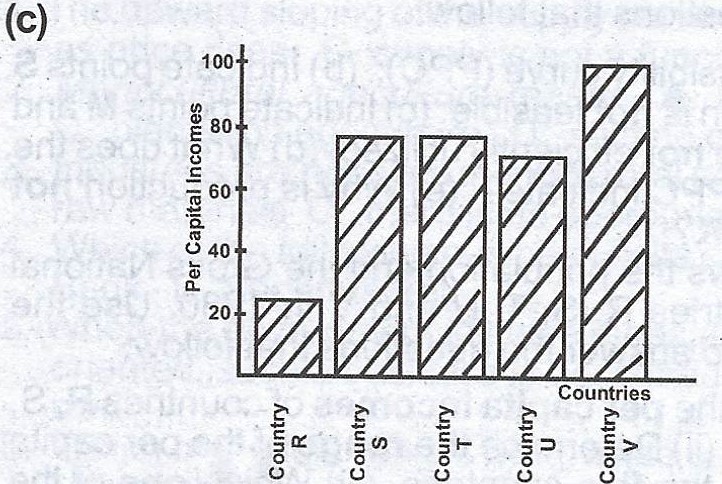
(a)(i) R, per capita income = \(\frac{2500} {120}\) = $20.83
S, per capita income = \(\frac{12,000} {80}\) = $66.66
T, per capita income = \(\frac{4,000} {60}\) = $65.66
U, per capita income = \(\frac{6,500} {100}\) = $65.00
V, per capita income = \(\frac{2,500} {25}\) = $100.00
(ii) Range $100 - $20.83 = $79.17
(iii) Country V.
(b)(i) R, 120 x 100 = 24.74%
485 1
S, 180 x 100 = 37.11%
485 1
T, 60 x 100 = 12.37%
485 1
U, 100 x 100 = 20.62%
485 1
V, 25 x 100 = 5.15%
485 1
| Countries | Population (in million) | GNP (in million Dollars) |
| R | 120 | 2,500 |
| S | 180 | 12,000 |
| T | 60 | 4,000 |
| U | 100 | 6,500 |
| V | 25 | 2,500 |
(a)(i) R, per capita income = \(\frac{2500} {120}\) = $20.83
S, per capita income = \(\frac{12,000} {80}\) = $66.66
T, per capita income = \(\frac{4,000} {60}\) = $65.66
U, per capita income = \(\frac{6,500} {100}\) = $65.00
V, per capita income = \(\frac{2,500} {25}\) = $100.00
(ii) Range $100 - $20.83 = $79.17
(iii) Country V.
(b)(i) R, 120 x 100 = 24.74%
485 1
S, 180 x 100 = 37.11%
485 1
T, 60 x 100 = 12.37%
485 1
U, 100 x 100 = 20.62%
485 1
V, 25 x 100 = 5.15%
485 1