Utility schedule
(a) Complete the above utility schedule
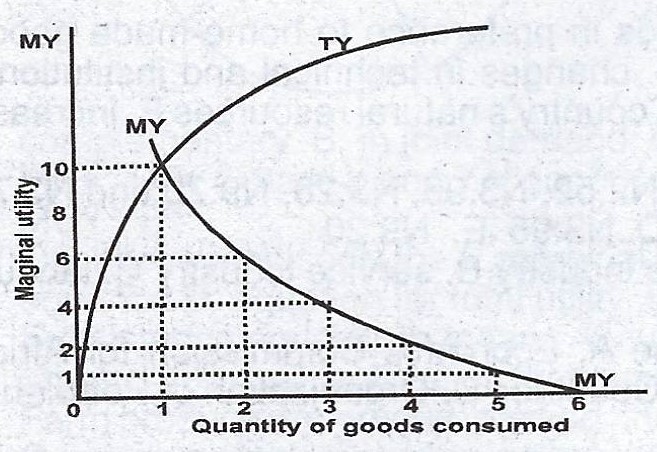
(b) Draw the marginal utility curve
C(i) At what quantity does TU equal MU?
(II) What is the value of MU when TU reaches the maximum?
(iii) What happens to the values of TU as the quantity consumed increases?
(iv) What happens to the values of MU as the quantity consumed increases?
| Quantity of goods consumed | Total Utility | Marginal Utility |
| 0 | 0 | 0 |
| 1 | 10 | 10 |
| 2 | 16 | - |
| 3 | - | 4 |
| 4 | - | - |
| 5 | 23 | 1 |
| 6 | 23 | - |
(a) Complete the above utility schedule
(b) Draw the marginal utility curve
C(i) At what quantity does TU equal MU?
(II) What is the value of MU when TU reaches the maximum?
(iii) What happens to the values of TU as the quantity consumed increases?
(iv) What happens to the values of MU as the quantity consumed increases?
Take Free Practice Test On 2026 JAMB UTME, Post UTME, WAEC SSCE, GCE, NECO SSCE
Correct Answer: Option n
Explanation:
a= 16 + 4 = 20;
b= 23 - 1 =22;
C= 16 - 10 =6;
d= 22 -20 = 2: e = 23 - 23 = 0
(b)
(c)(i) Tu = mu at 1 unit and 0 unit
(ii) Tu reaches maximum at 1
(iii) The value of Tu increases up to a point and begins to decline.
(iv) Mu's value will diminish.
| Quantity of goods consumed | Total utility | Marginal Utility |
| 0 | 0 | 0 |
| 1 | 10 | 10 |
| 2 | 16 | (6)c |
| 3 | (20)a | 4 |
| 4 | (22)b | (2)d |
| 5 | 23 | 1 |
| 6 | 23 | (0)e |
a= 16 + 4 = 20;
b= 23 - 1 =22;
C= 16 - 10 =6;
d= 22 -20 = 2: e = 23 - 23 = 0
(b)
(c)(i) Tu = mu at 1 unit and 0 unit
(ii) Tu reaches maximum at 1
(iii) The value of Tu increases up to a point and begins to decline.
(iv) Mu's value will diminish.