The daily sales of a department store for one week are as follows
(a) Present the above data in a bar graph. (The use of graph sheet is essential).
(b) Calculate the average utility curve.
| Days | Mon | Tue. | Wed. | Thu. | Fri. | Sat. |
| Sales N | 1750 | 1000 | 3500 | 2250 | 1000 | 2500 |
(a) Present the above data in a bar graph. (The use of graph sheet is essential).
(b) Calculate the average utility curve.
Take Free Practice Test On 2026 JAMB UTME, Post UTME, WAEC SSCE, GCE, NECO SSCE
Correct Answer: Option n
Explanation:
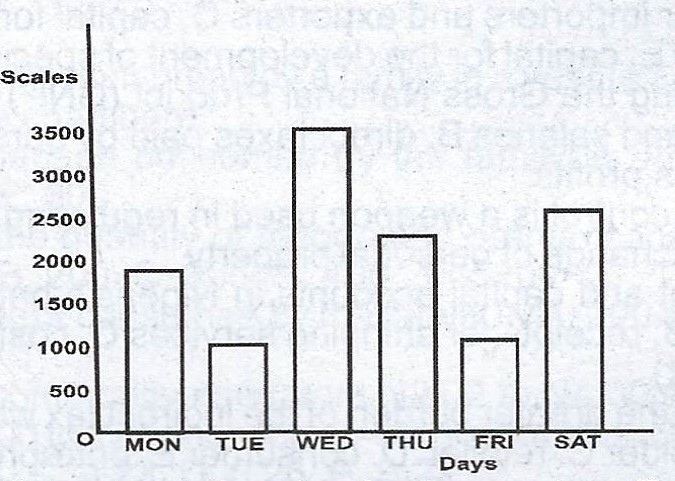
(b) Average daily sales for the week = Total sales
No. of days
\(\frac{N1,750 + 1,000 + 3,500 + 2,250 + 1,000 + 2,500} {6}\)
\(\frac{12000}{6}\) = N2,000
(b) Average daily sales for the week = Total sales
No. of days
\(\frac{N1,750 + 1,000 + 3,500 + 2,250 + 1,000 + 2,500} {6}\)
\(\frac{12000}{6}\) = N2,000