(a) Plot a combined rainfall and temperature graph for Station X
(b) Calculate the (i) annual temperature range (ii) mean annual temperature for the station
(c) What climatic type does the station represent?
(b) Calculate the (i) annual temperature range (ii) mean annual temperature for the station
(c) What climatic type does the station represent?
Take Free Practice Test On 2026 JAMB UTME, Post UTME, WAEC SSCE, GCE, NECO SSCE
Correct Answer: Option n
Explanation:
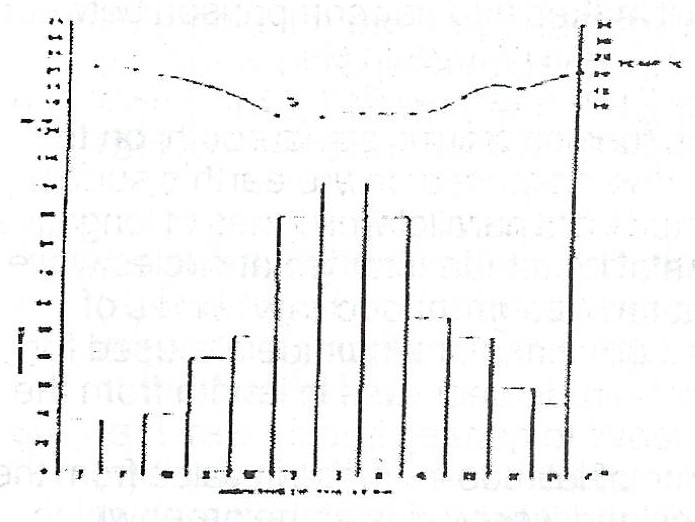
(a) Plot a combined rainfall and temperature graph for station X
(b) Annual temperature range = Month with highest temperature minus month with lowest temperature Annual temperature range = 21°C - 12°C = 9°C
(ii) To derive the mean annual temperature add up all the temperatures for the year and divide by 12 Mean annual temperature
= 21 + 21 + 20 + 17 + 15 + 12 + 12 + 13 + 14 + 18 + 18 + 20
12
201 = 16.8°C
12
(c) The climatic type is Mediterranean climate